What's New
Recent enhancements to the dashboard and order-flow engine.
Analytics Tab — overlay control & de-clutter
- Per-overlay toggle chips in the chart header: Clusters Big Trades S/R Pools Weekly — click each to show/hide that overlay independently.
- Label de-clutter: overlapping left-edge labels are now collision-avoided (one label per vertical row), and S/R labels are a single compact line.
- Persistence: your overlay toggle/filter choices are saved in the browser and restored on refresh.
CVD Panel — clearer signals
- Buy/Sell markers: absorption (▲ amber) and exhaustion (▼ pink) now carry a B/S glyph showing which side (buy vs sell aggression) the event was on.
- Divergence detection: price-vs-CVD divergences are scanned across all recent swing pivots (not just the last two) and drawn as a connecting line — catches divergences that sit between earlier swings.
- Absorption/exhaustion fire against a rolling 20-bar baseline, so they trigger in calm periods, not only during volatile stretches.
Footprint Tab — higher timeframes
- 1h / 4h / 1D footprints are now dense, resampled from the persisted 5m footprint history (previously HTF showed only a handful of candles).
Layout
- Collapsible right panel: a thin toggle rail on the right hides the side panels so the chart can use the full width. Wider charts now reveal many more candles.
- Persistent status footer (Bias / Score / Risk / P&L / Stalking) now shows on every tab, not just the Chart tab.
- Settings tab uses a multi-column layout on wide screens.
ML Scoring & Strategy Scorecard
- All scores are real, live computations — never mock data. A module reading exactly 50 means "neutral / no actionable signal this cycle" (dimmed in the panel); green >50 is bullish, red <50 bearish.
- The Strategy Scorecard shows live per-cycle condition checks (bias, structure, absorption, imbalance, ATR, timing) with their target thresholds.
See the section-by-section pages below for full detail on each tab and panel.
Quick Start
Prerequisites
- Python 3.12+
- Node.js 18+
- Docker Desktop (for TimescaleDB)
- Bybit Global account with API keys
Start the System
# 1. Start database
cd pjoy && docker compose up db -d

# 2. Start backend (trading engine)
cd backend && python -m uvicorn pjoy.main:app --host 127.0.0.1 --port 8000

# 3. Start dashboard (separate terminal)
cd dashboard && npm run devFirst Run Checklist
.envconfigured with Bybit API keys- Docker Desktop running
- Backend logs show "Exchange connected"
- Dashboard header shows green status dot
Safety: TRADING_ENABLED=false by default — the engine scans for signals but never places orders until you explicitly enable it.
Dashboard Overview
┌─────────────────────────────────────────────────────────────────────┐
│  HEADER: [BTC/USDT ▼] [5m][15m][1h][4h]    07:15:30 MYT    ● Online│
├─────────────────────────────────────────────────────────────────────┤
│  TABS: [Chart] [Footprint] [Analytics] [History] [Settings]         │
├─────────────────────────────────────────────┬───────────────────────┤
│                                             │  Positions            │
│         MAIN CONTENT AREA                   │  ML Scoring           │
│         (varies by tab)                     │  Strategy Scorecard   │
│                                             │  Risk                 │
│                                             │  Trade Feed           │
├─────────────────────────────────────────────┴───────────────────────┤
│  PRE-SESSION: Bias: — | Score: 50 | Risk: Clear | P&L: $0.00       │
└─────────────────────────────────────────────────────────────────────┘
Chart Tab
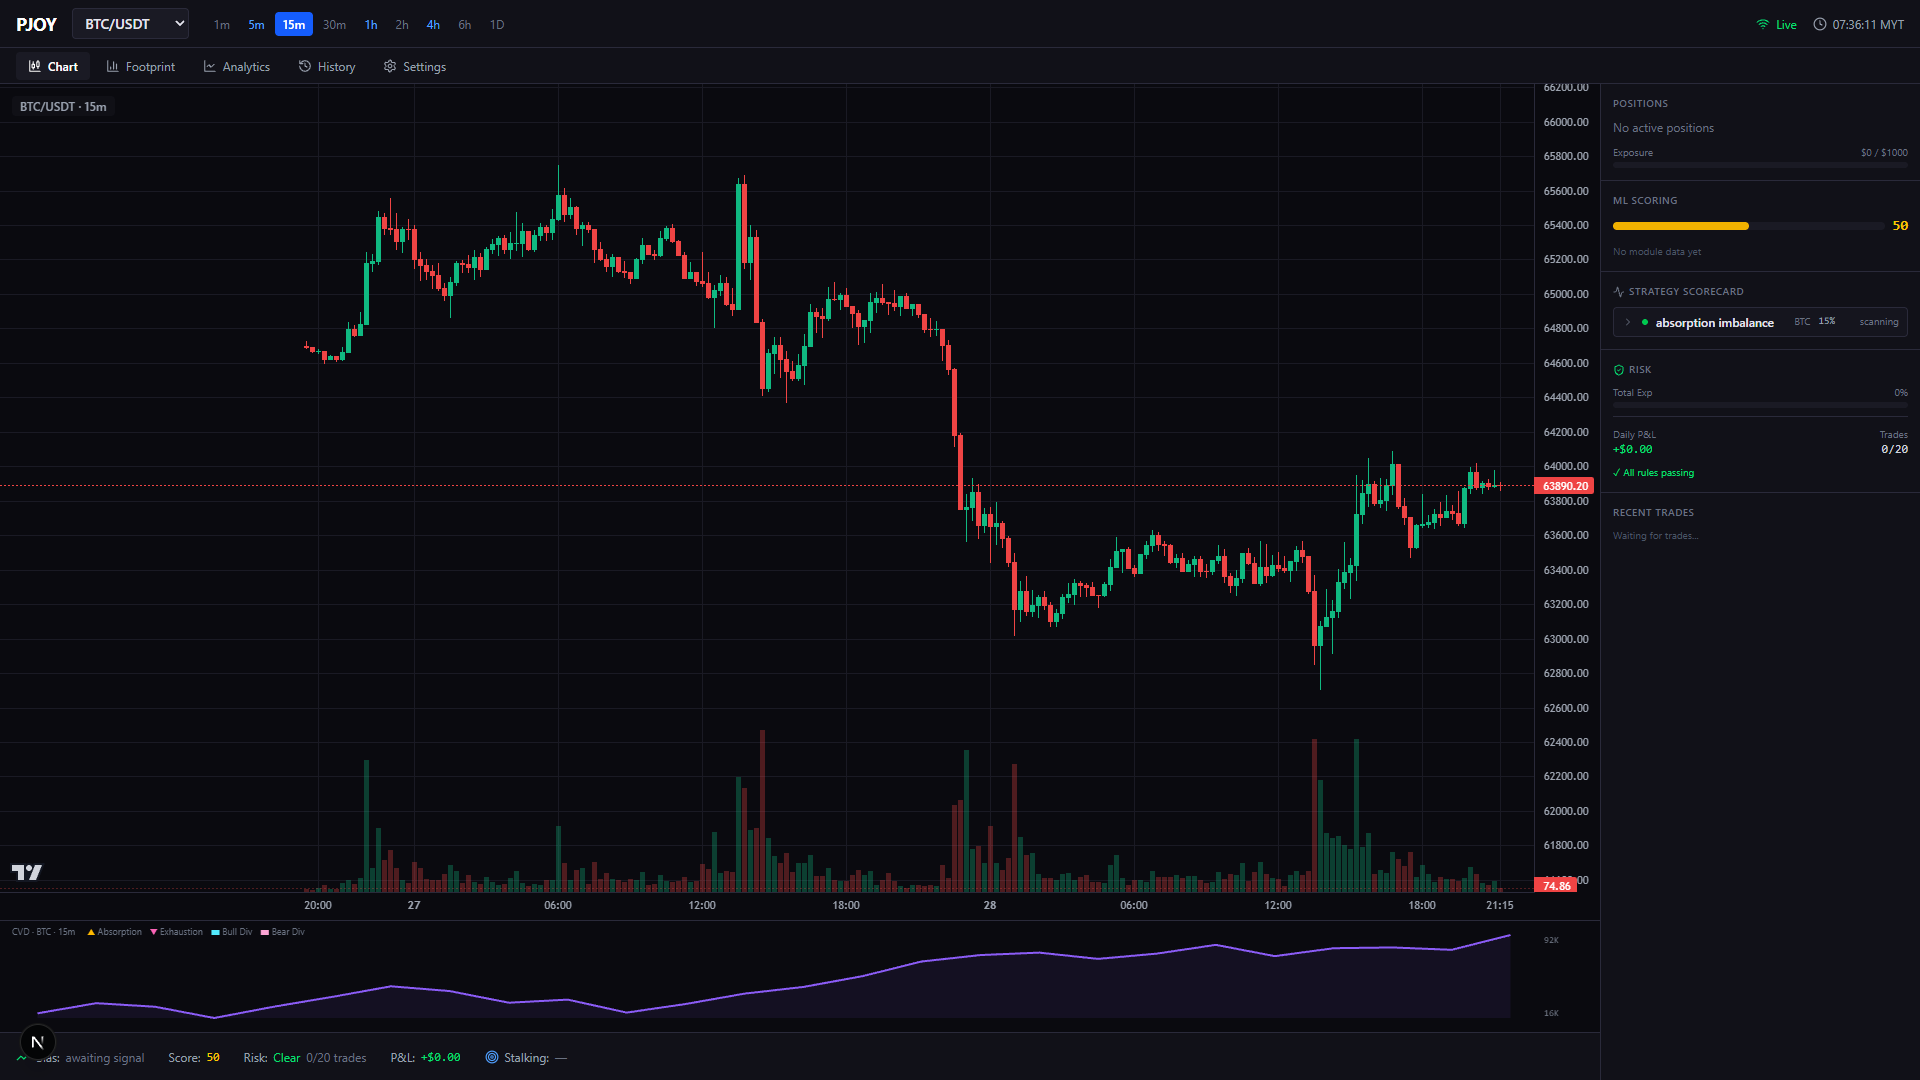
Clean OHLC candlestick chart with volume. Reserved for viewing trade position/order labels.
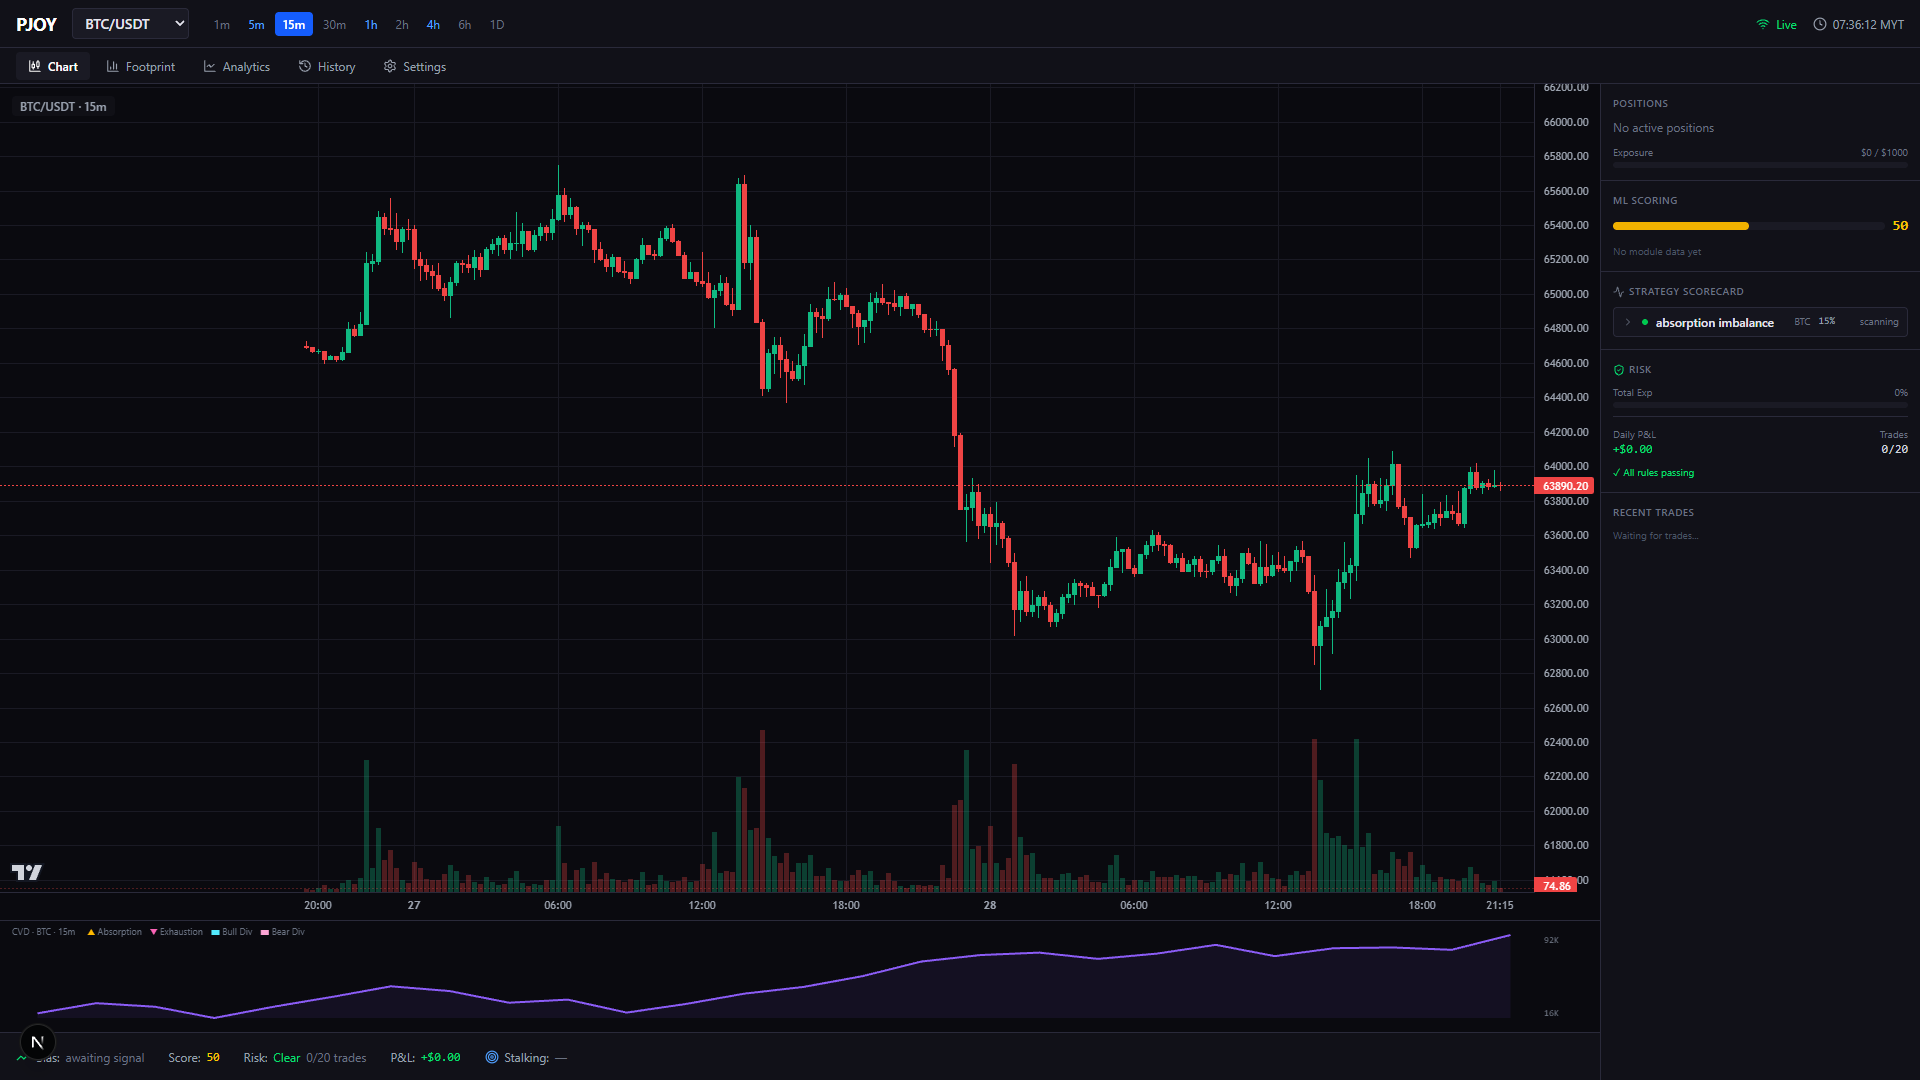
CVD Sub-Chart
Below the candles, the CVD (Cumulative Volume Delta) chart shows net buying/selling pressure over time.
Legend
| Signal | Meaning | Action Implication |
|---|---|---|
| Absorption | Large opposite volume absorbed without price follow-through | Potential reversal — defenders holding the level |
| Exhaustion | Extreme delta (momentum climax) | Trend may be ending — watch for reversal |
| Bull Divergence | Price lower low, CVD higher low | Hidden buying — potential bullish reversal |
| Bear Divergence | Price higher high, CVD lower high | Hidden selling — potential bearish reversal |
Footprint Tab
Orderflow visualization showing bid/ask volume at each price level within every candle.
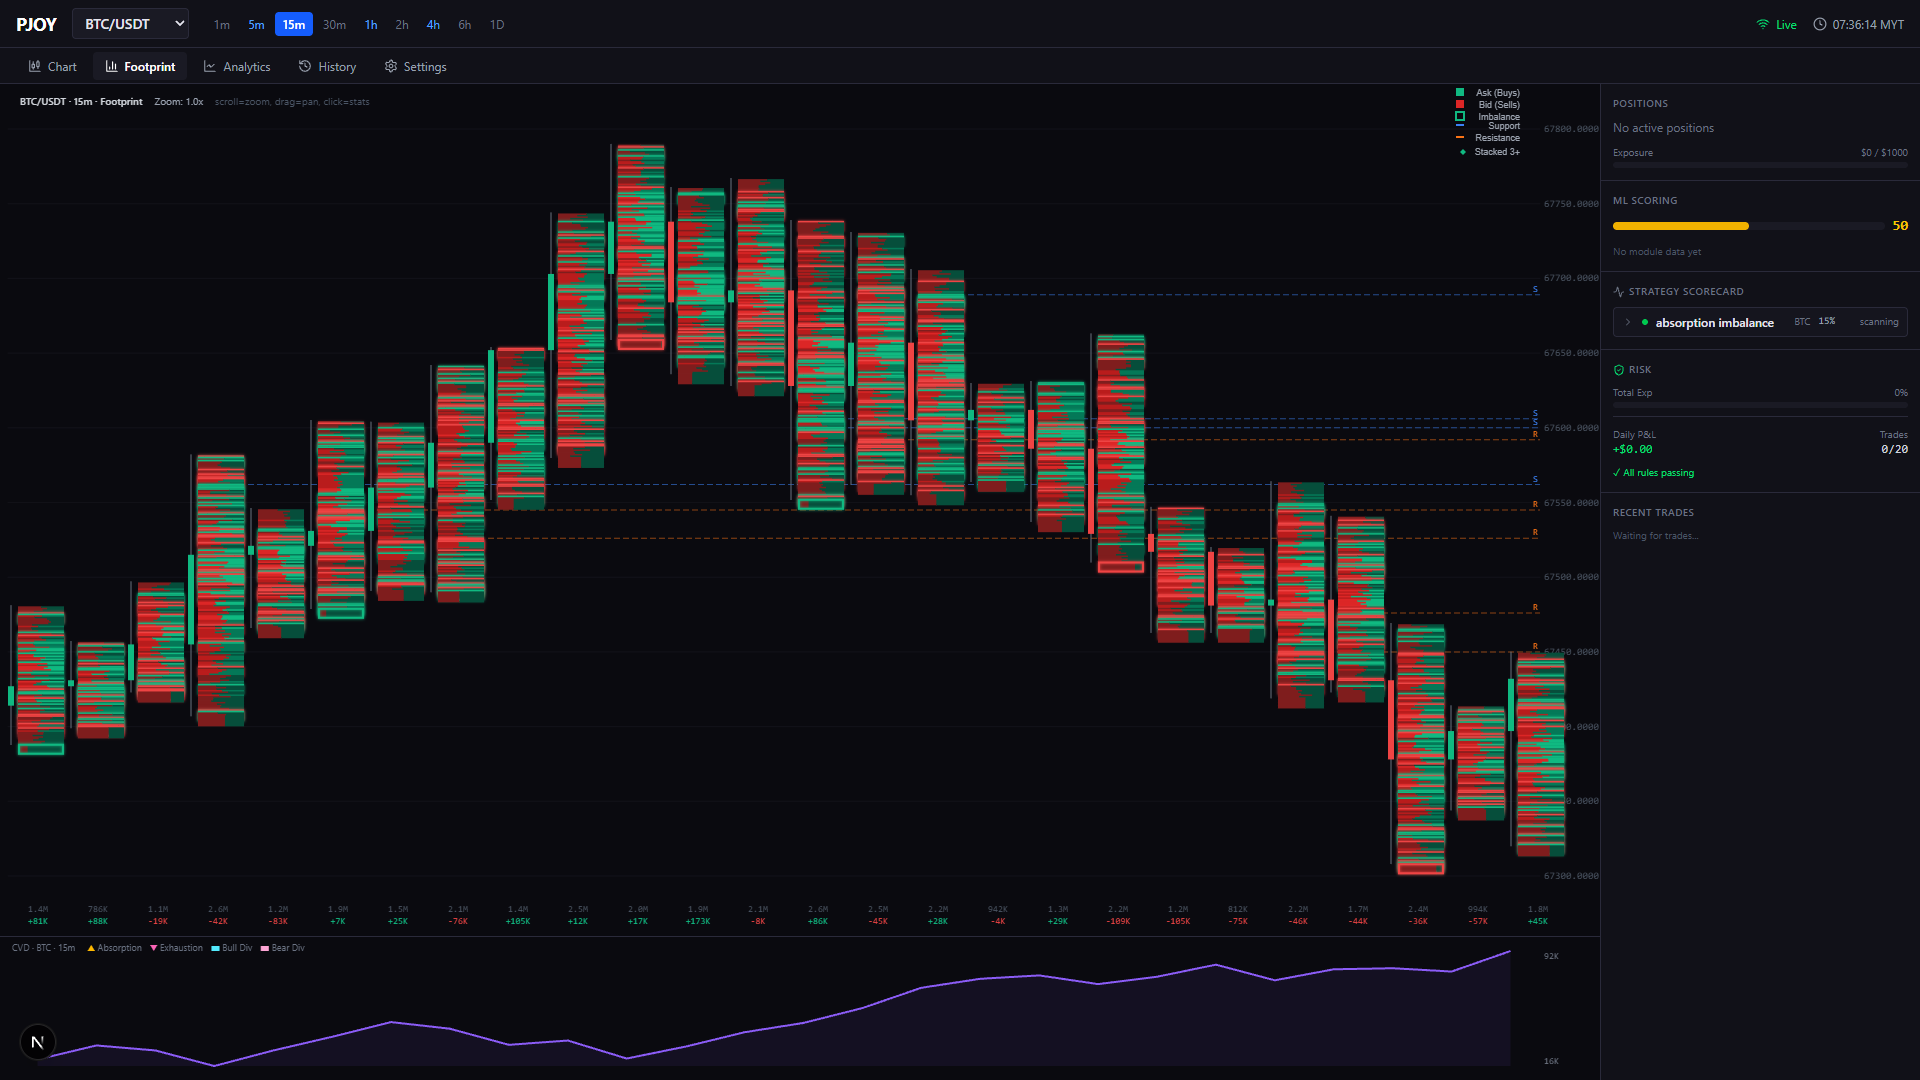
Reading the Footprint
| Element | Visual | Meaning |
|---|---|---|
| OHLC Bar | Thin colored bar on left edge | Candle body (green=bullish, red=bearish) |
| Cell text | 2K×4K | Bid volume × Ask volume at that price level |
| Cell color | Green shading | Ask (buy) dominant — darker = higher volume |
| Cell color | Red shading | Bid (sell) dominant — darker = higher volume |
| Glowing border | Green glow | Buy imbalance (ask/bid ratio ≥ 3:1) |
| Glowing border | Red glow | Sell imbalance (bid/ask ratio ≥ 3:1) |
| Diamond ◆ | At candle H/L | 3+ stacked imbalances (strong S/R forming) |
| Dashed line → | Blue | Support projection from stacked buy imbalances |
| Dashed line → | Orange | Resistance projection from stacked sell imbalances |
Controls
| Action | How |
|---|---|
| Zoom | Mouse scroll wheel (0.3x – 4.0x) |
| Pan | Click + drag horizontally |
| Cluster Stats | Click any candle → sidebar with OHLC, Bid/Ask %, Delta, POC |
| Crosshair sync | Hover → blue vertical line synced with CVD below |
Analytics Tab
Combined orderflow analysis with three overlay layers on a candlestick chart + CVD sub-chart.
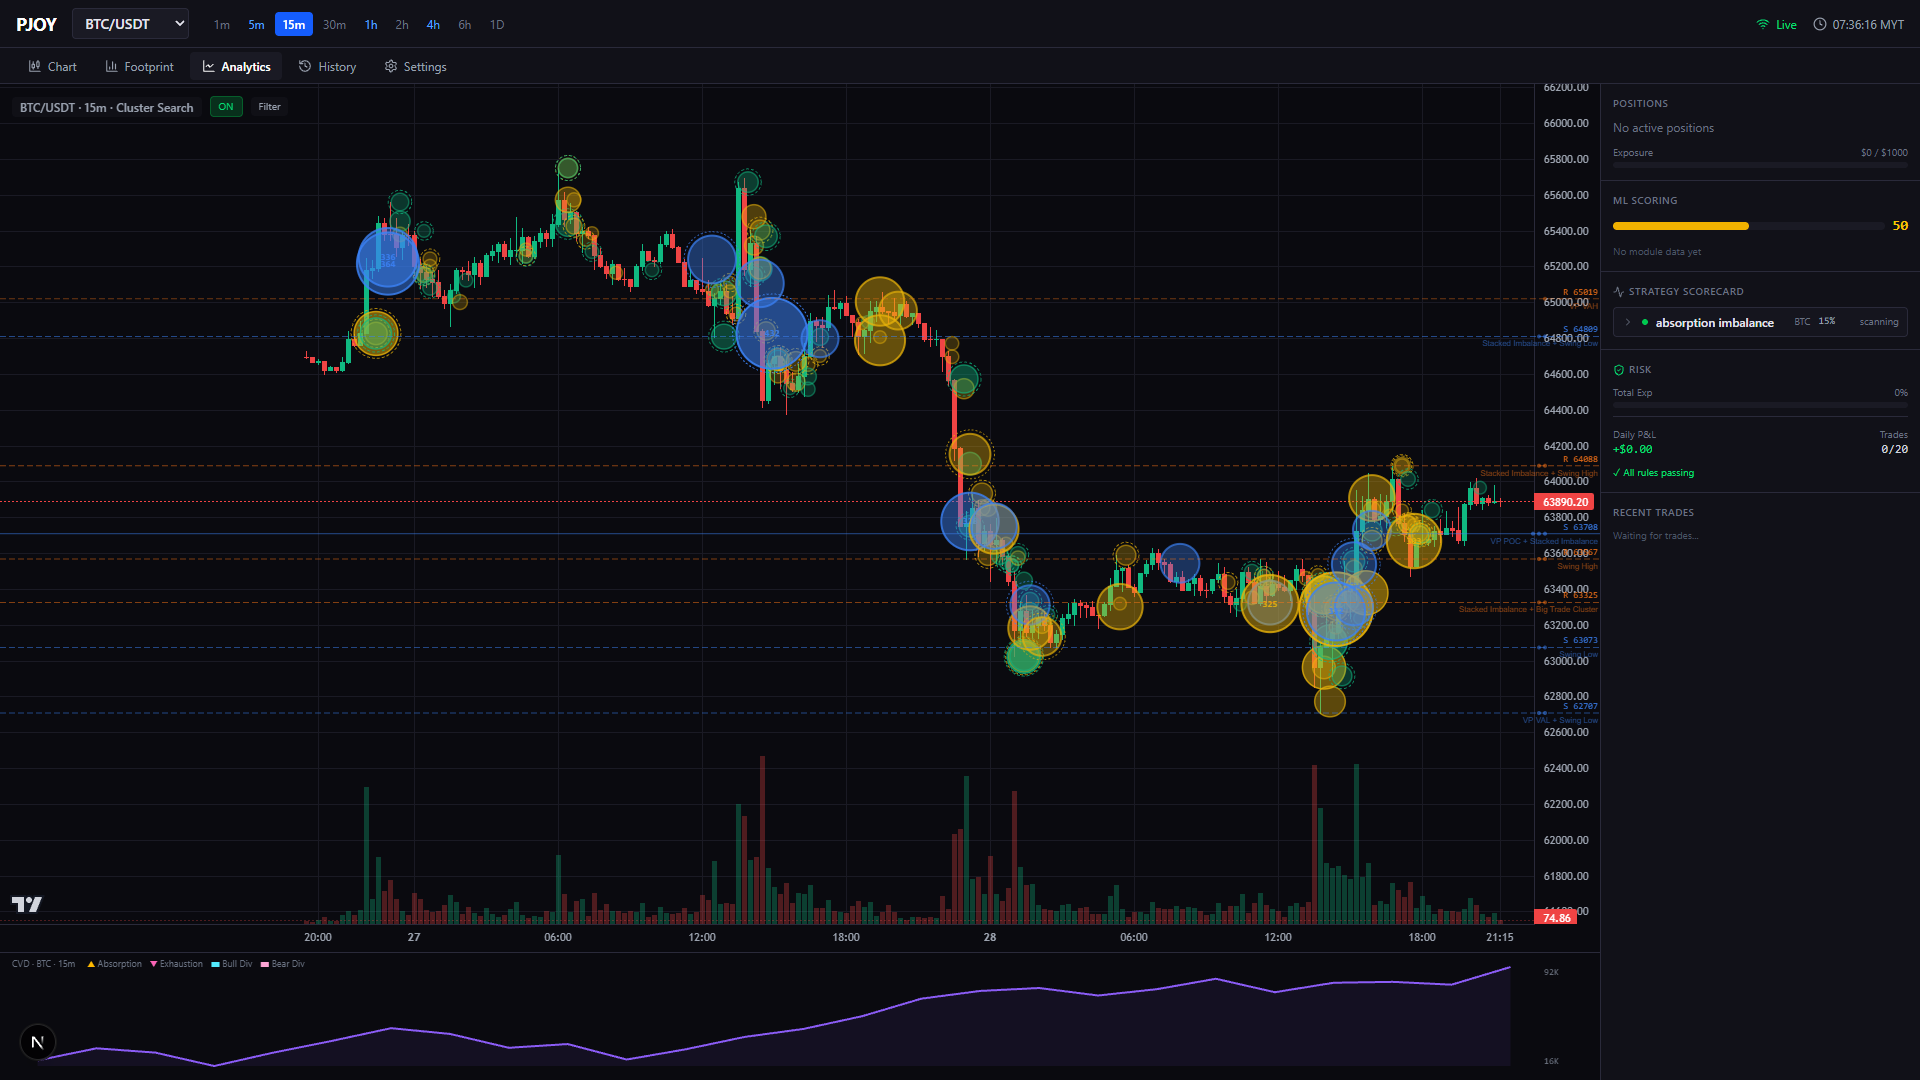
Layer 1: Cluster Search
Highlights volume concentrations at specific price levels within each candle.
Layer 2: Big Trades
Individual whale/institutional executions — re-aggregated from fragmented exchange prints.
Layer 3: S/R Levels
Multi-factor confluence support and resistance lines.
S/R Detection Method (5 factors)
| Factor | Weight | What it detects |
|---|---|---|
| Volume Profile POC/VAH/VAL | 30% | Where most volume traded (institutional fair value) |
| Stacked Imbalance Zones | 25% | Unfilled aggressive orders defending a price |
| Swing High/Low | 20% | Previous price rejection points |
| Big Trade Clusters | 15% | Whale cost basis (they defend their entries) |
| Round Numbers | 10% | Psychological levels |
Filter Panel
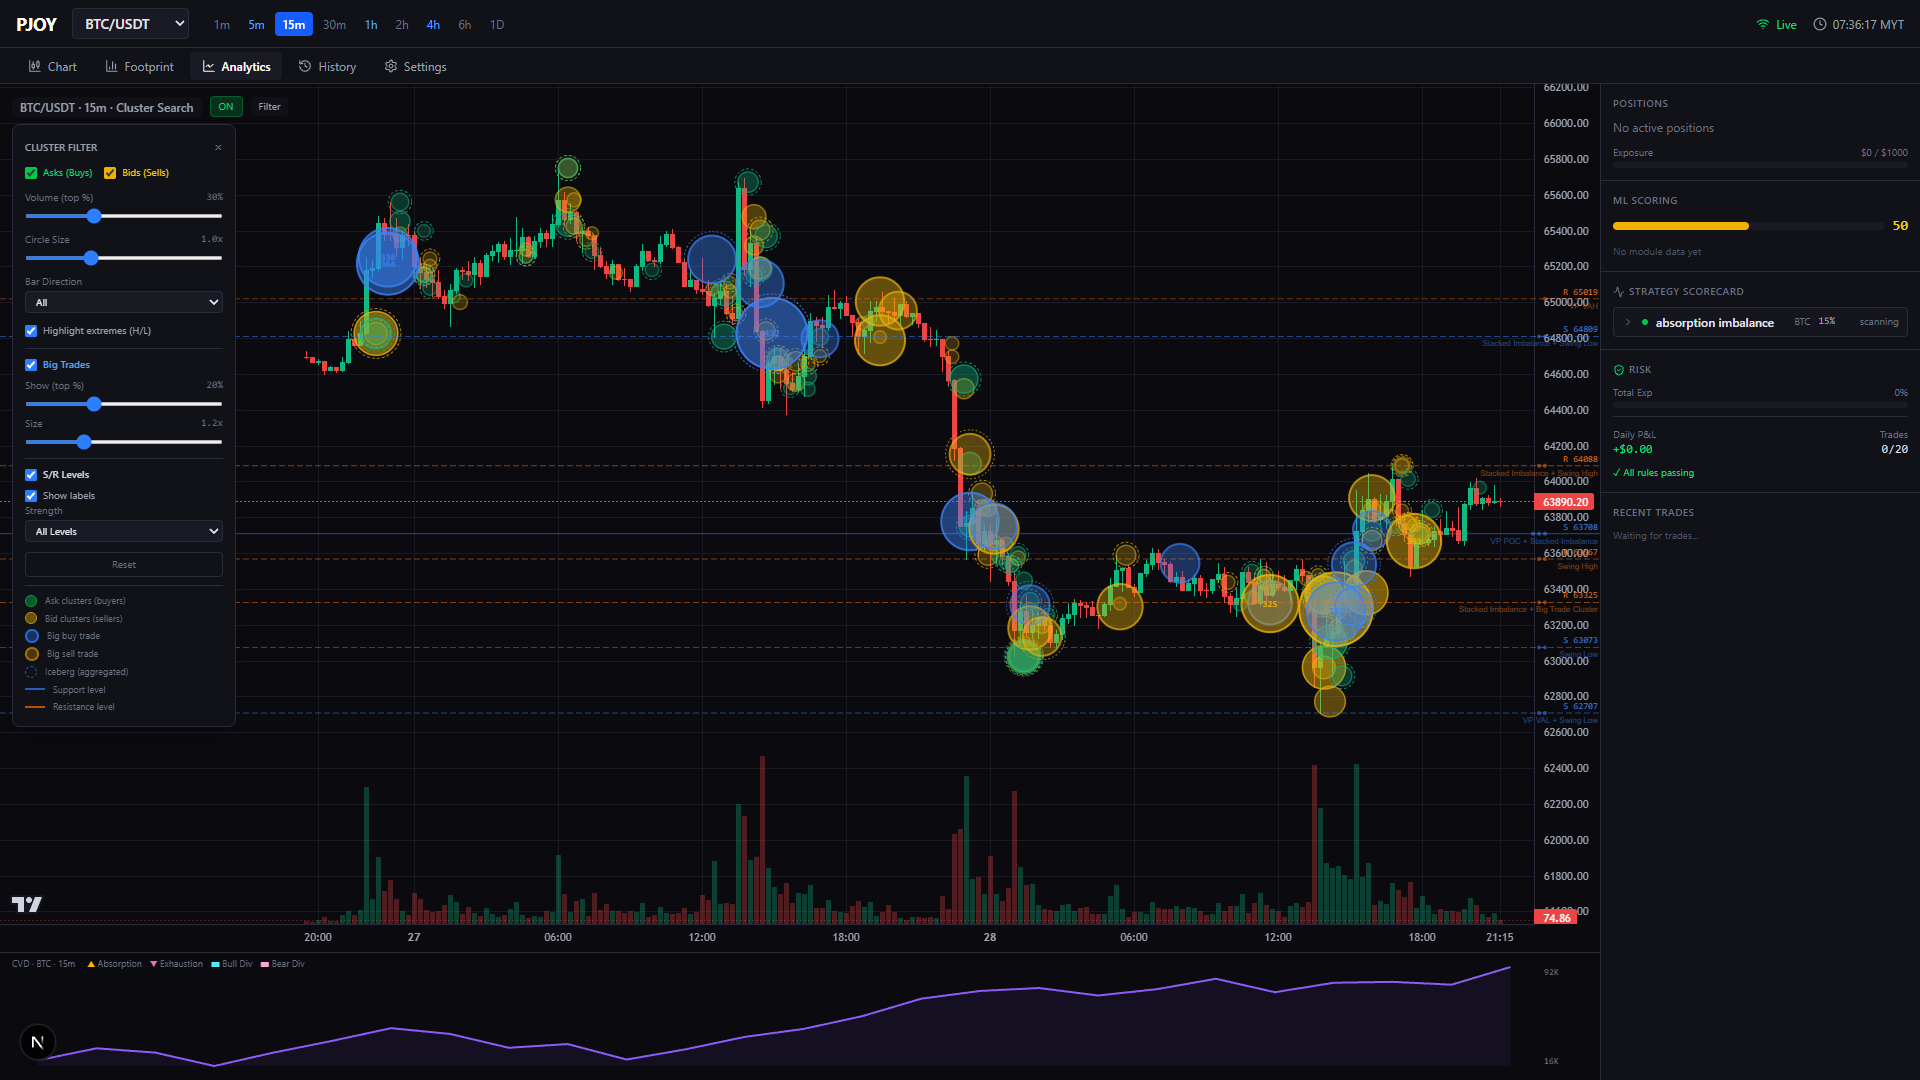
| Section | Controls |
|---|---|
| Clusters | Toggle asks/bids, volume threshold %, circle size, bar direction |
| Big Trades | Toggle ON/OFF, top N% filter, size scale |
| S/R Levels | Toggle ON/OFF, show/hide labels, strength (All / Strong / Weak) |
| Highlight Extremes | Show outer ring on H/L clusters |
Positions Panel
Shows open positions with side (Long/Short), margin P&L %, and total exposure vs limit.
ML Scoring Panel
Composite confidence score (0-100). Green (70+) = favorable, Yellow (40-70) = caution, Red (<40) = no trade. Shows per-module breakdown when modules are registered.
Strategy Scorecard
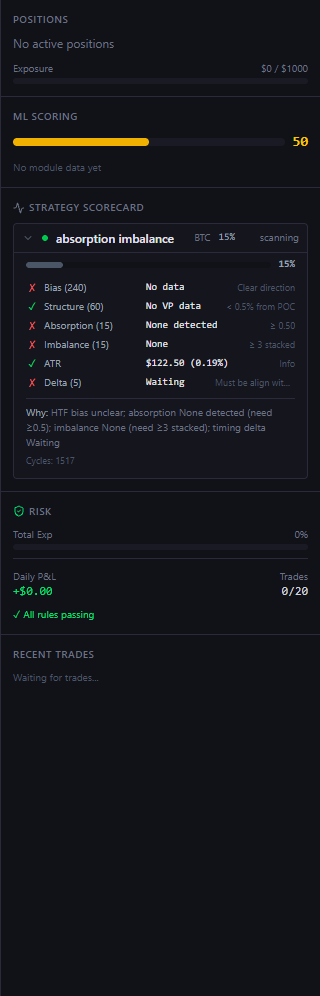
Expandable panel showing real-time strategy evaluation. Click to expand and see:
- Score progress bar (0-100%)
- Per-condition pass/fail: Bias, Structure, Absorption, Imbalance, ATR, Delta timing
- Current value vs required threshold for each condition
- "Why not firing" in plain English
- Cycle count and last signal time
Risk Panel
Total exposure bar, per-coin breakdown, daily P&L, trade count, and rules status (all passing / blocked).
Trade Feed
Real-time WebSocket feed showing trade events (opened/closed) with time, symbol, side, P&L.
Strategy: Absorption + Imbalance
Detects when strong participants are defending key S/R levels by absorbing opposite flow, confirmed by stacked order imbalances.
4h (Bias)        ──► CVD + Delta direction = market bias
     │
1h (Structure)   ──► Price near VP POC/VAL/VAH = structural level
     │
15m (Entry)      ──► Absorption detected at stacked imbalance zone
     │
5m (Timing)      ──► Delta aligns with bias direction
     │
     ▼
SIGNAL FIRED     ──► Risk Manager evaluates ──► Order Executor places trade
Entry Conditions
| Condition | Threshold | Description |
|---|---|---|
| HTF Bias | CVD + Delta aligned | 4h CVD and delta both positive (long) or both negative (short) |
| Structure | < 0.5% from POC | 1h price within 0.5% of volume profile key level |
| Absorption | Confidence ≥ 0.50 | Opposite volume absorbed without price movement |
| Imbalance | ≥ 3 stacked levels | 3+ consecutive levels with ≥ 3:1 bid/ask ratio |
| Timing | Delta aligned | 5m delta direction matches the HTF bias |
TP / SL Logic
| Parameter | Method |
|---|---|
| Take Profit | Next VP level (POC/VAH/VAL) or ATR × 2.0 |
| Stop Loss | Below/above absorption level + ATR × 1.5 |
| Trailing Stop | Activates after 50% TP reached |
TF Presets
| Preset | Bias | Structure | Entry | Timing |
|---|---|---|---|---|
| Standard Day Trade | 4h | 1h | 15m | 5m |
| Aggressive Intraday | 1h | 15m | 5m | 1m |
| Conservative Swing | 1D | 4h | 1h | 15m |
Risk Rules
| Rule | Default | Description |
|---|---|---|
| Total Exposure | $1,000 | Max total position value across all coins |
| Per-Coin Exposure | $500 | Max for any single coin |
| Daily Loss Limit | -$100 | Halts all trading for the day |
| Max Concurrent | 5 | Max simultaneous open positions |
| Max Drawdown | 15% | From equity peak |
| Leverage Guard | 10x until 100 trades | New accounts limited |
| Volatility Halt | 5% ATR | Pause if volatility spikes |
| No-Trade Window | 21:30-21:35 MYT | First 5 min of NY Open |
Safety: Daily P&L persists across restarts — you cannot bypass the daily loss limit by restarting the bot.
Deployment Guide
Local Development
docker compose up db -d
cd backend && python -m uvicorn pjoy.main:app --host 127.0.0.1 --port 8000
cd dashboard && npm run dev
VPS Production
# Configure
cp backend/.env.example backend/.env
# Edit: AUTH_ENABLED=true, JWT_SECRET=<random>, TRADING_ENABLED=true

# Deploy
docker compose up -d

# Verify
curl http://your-vps:8000/health
Going Live Sequence
- Run
TRADING_ENABLED=falsefor 24-48h (observe) - Verify strategy scorecard shows expected behavior
- Set
TRADING_ENABLED=true - Start with small
cost_usdt=$5 - Monitor daily P&L and drawdown
- Gradually increase after 20+ successful trades
Configuration (.env)
| Variable | Default | Description |
|---|---|---|
EXCHANGE_API_KEY | — | Bybit API key (mainnet) |
EXCHANGE_API_SECRET | — | Bybit API secret |
TRADING_ENABLED | false | Must be true to place orders |
OPERATING_MODE | manual | manual or autonomous |
CYCLE_INTERVAL_SEC | 5.0 | Strategy scan frequency |
DB_URL | postgresql://... | TimescaleDB connection |
AUTH_ENABLED | false | JWT auth for VPS |
JWT_SECRET | change-me | Must set before enabling auth |
SCORING_GATE_ENABLED | false | Require min ML score |
SCORING_GATE_THRESHOLD | 65 | Min score to trade |
Troubleshooting
Dashboard shows "offline"
curl http://localhost:8000/health
# If no response: restart backend
python -m uvicorn pjoy.main:app --host 127.0.0.1 --port 8000
Webpack module error
cd dashboard && rm -rf .next && npm run devExchange connection failed
# Test connectivity
curl https://api.bybitglobal.com/v5/market/time
# Must use bybitglobal.com (not bybit.com)
Strategy not firing
Expand the Strategy Scorecard to see which conditions fail. Common reasons:
- "No data" = exchange not connected or candles not backfilled
- "Bias unclear" = 4h CVD/Delta not aligned (wait)
- "Absorption None detected" = normal — waiting for setup to form
pjoy v0.1.0 — Last updated July 2026